Ingesting Windows Logs
Author: Roger C.B. Johnsen
Introduction
Windows logs are vital for threat hunters because they provide critical insights into system activities, security incidents, and potential vulnerabilities. These logs capture detailed information about user actions, application behaviors, and system events, helping to identify suspicious activities and trace the steps of potential threats. By analyzing Windows Event Logs, threat hunters can detect anomalies, investigate security breaches, and ensure robust system defenses.
This chapter offers a generic guide for ingesting Windows .evtx logs into OpenSearch. This process will help you centralize and analyze your Windows logs, facilitating more effective threat detection and response within your security infrastructure.
Types of Windows Logs
There aren’t just one central Windows log, sadly. Here’s a quick rundown of the available logs:
| Log Type | Description |
|---|---|
| Application Logs | Contains events logged by applications or programs, such as errors from a database application. |
| Security Logs | Records events related to security, such as login attempts and access to resources. Essential for audits. |
| System Logs | Includes events logged by Windows system components, such as driver failures during startup. |
| Setup Logs | Contains events related to software installations and updates, useful for troubleshooting installation issues. |
| Forwarded Events | Logs collected from other systems in a centralized location, useful in environments with multiple computers. |
How to Obtain Windows Logs
Most often you will already hunt in a SIEM where the logs are already present. If you ever wonder how to obtain these logs from a Windows system, then this is one way to do so:
- Press
Win + R, typeeventvwr, and pressEnter - Navigate to categories like “Application,” “Security,” etc.
- Right-click on a log, select “Save All Events As…”, choose
.evtxformat, and specify the location.
This simplified list provides the essential steps for obtaining Windows logs using Event Viewer and exporting them in .evtx format.
Prerequisites before the first ingest
Before we can ingest Windows logs for the first time, there are some steps we need to do to prepare OpenSearch.
Enabling OpenSearch compability setting
Historically, many multiple popular agents and ingestion tools have worked with Elasticsearch OSS, such as Beats, Logstash, Fluentd, FluentBit, and OpenTelemetry. OpenSearch aims to continue to support a broad set of agents and ingestion tools, but not all have been tested or have explicitly added OpenSearch compatibility. As an intermediate compatibility solution, OpenSearch has a setting that instructs the cluster to return version 7.10.2 rather than its actual version. If you use clients that include a version check, such as versions of Logstash OSS or Filebeat OSS between 7.x - 7.12.x, enable the setting:
PUT _cluster/settings
{
  "persistent": {
    "compatibility": {
      "override_main_response_version": true
    }
  }
}
Enable this setting by going into the “Dev Tools” tool (“Hamburger menu” -> “Management” -> “Dev Tools”). Paste the above code into the left side panel, then hit the “Click to send request”/“Play” button. The status from this query is shown in the right panel, like so:
Download Winlogbeat
Winlogbeat is a lightweight shipper for forwarding and centralizing Windows Event Logs. It is part of the Elastic Stack (ELK Stack) and is specifically designed to collect Windows event logs and forward them to Elasticsearch, Logstash, or a third-party service for further analysis and visualization.
When we say shipper, we mean “a binary that take your logs and sends it to the SIEM” - to put it bluntly. You can obtain Winlogbeat from here:
Make sure to cast a glimps of the technical documentation available here before running it:
Install Winlogbeat
We are goint to download the “Windows ZIP 64-bit” version and run it from a Windows machine. Winlogbeat is intended to be installed as a service, but we’ll use it to ship Windows logs adhoc from the command line.
Download said file to C:\WinlogBeat or any suitable place, then unzip.
Configure Winlogbeat
Create a Winlogbeat configuration file (winlogbeat.yml) with the following content in the same folder you unzipped the Winlogbeat application:
winlogbeat.event_logs:
  - name: ${EVTX_FILE}
    no_more_events: stop

winlogbeat.shutdown_timeout: 10s
winlogbeat.registry_file: evtx-registry.yml
output.elasticsearch.hosts: ['http://127.0.0.1:9200']
If using HTTPS, please consider the following:
winlogbeat.event_logs:
  - name: ${EVTX_FILE}
    no_more_events: stop

winlogbeat.shutdown_timeout: 10s
winlogbeat.registry_file: evtx-registry.yml
output.elasticsearch:
  hosts: ["https://127.0.0.1:9200"]
  username: "" # Change this
  password: "" # Change this
output.elasticsearch.ssl.verification_mode: none
Shipping logs to OpenSearch
Run the following command in Windows powershell.exe:
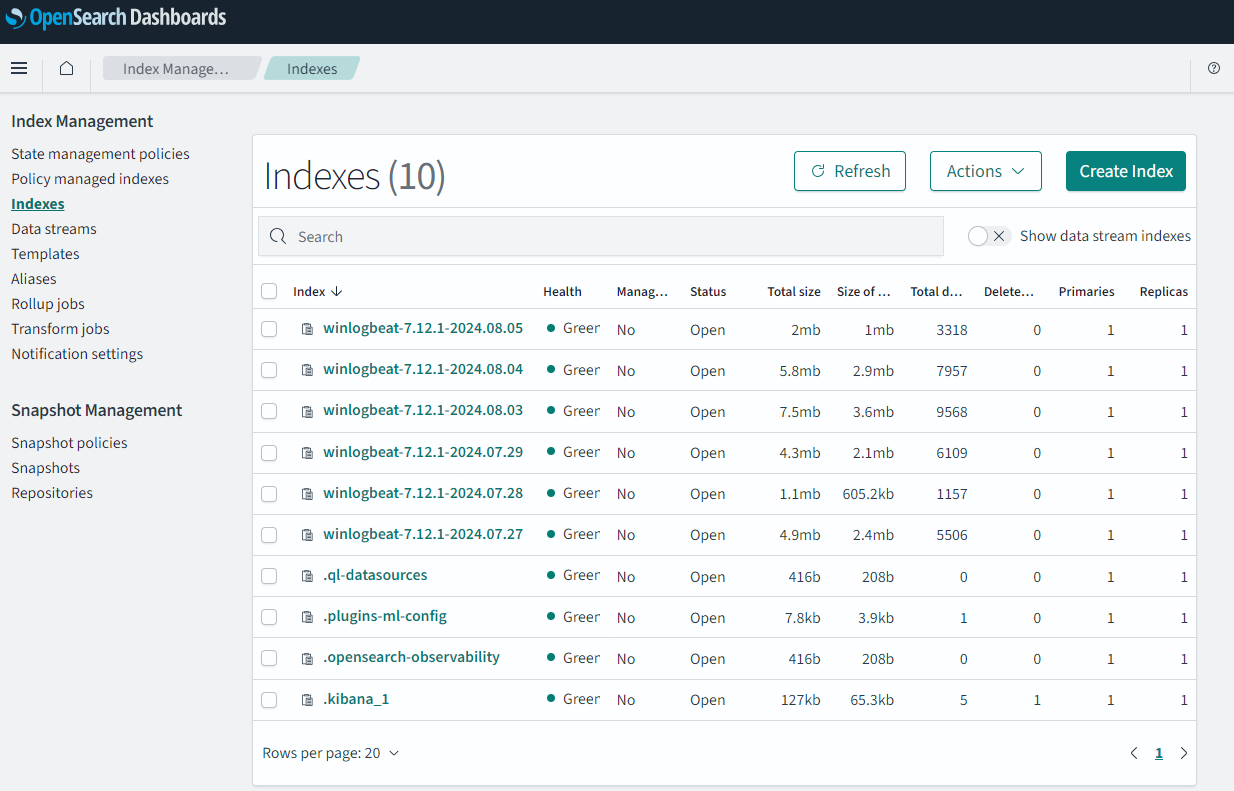
PS C:\Winlogbeat> winlogbeat-7.12.1-windows-x86_64\winlogbeat.exe -e -c C:\Winlogbeat\winlogbeat.yml -E EVTX_FILE=C:\Winlogbeat\security.evtxIf success, you should have several “winlogbeat-*” indices under “Index Management” (“Hamburger menu” -> “Management” -> “Index Management” -> “Indexes”).
Create Index Alias
For us to make use of these in “Discovery”, we must set up Index Alias for these.
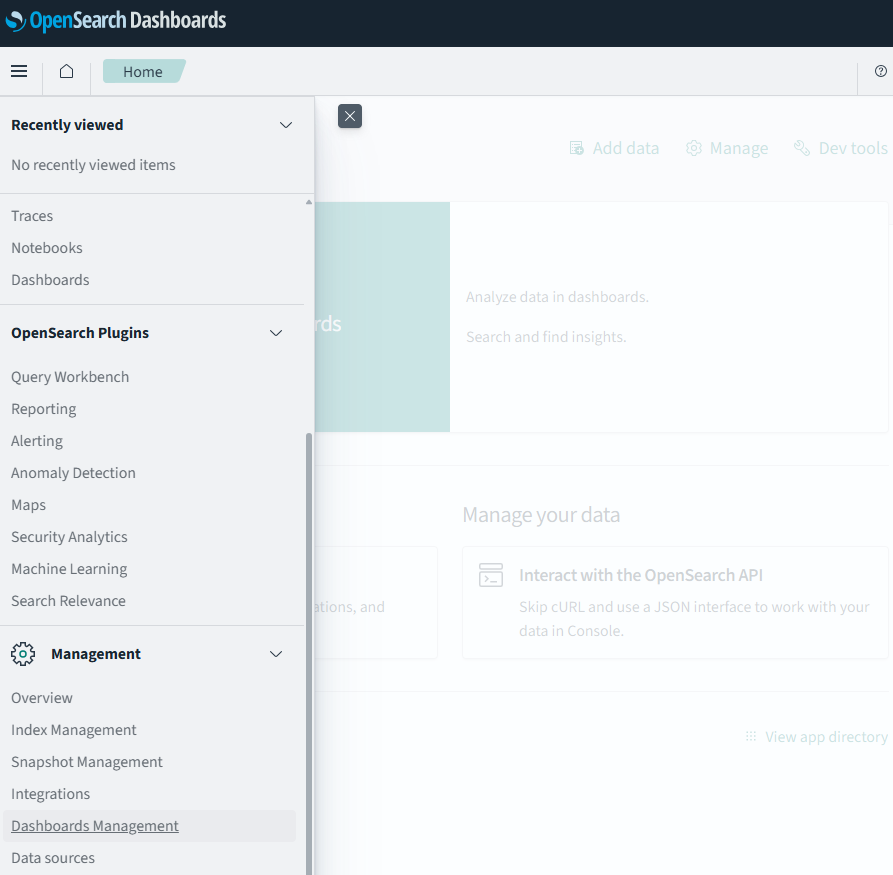
Keep in mind that “Discover” (the main query interface) knows nothing about these indices, thus you can’t search into them directly. You first need to create index aliases for “Discover” to see them. You can do so by reaching the “Dashboard Management” utility by going to this path: “Hamburger menu” -> Management -> “Dashboard Management”:
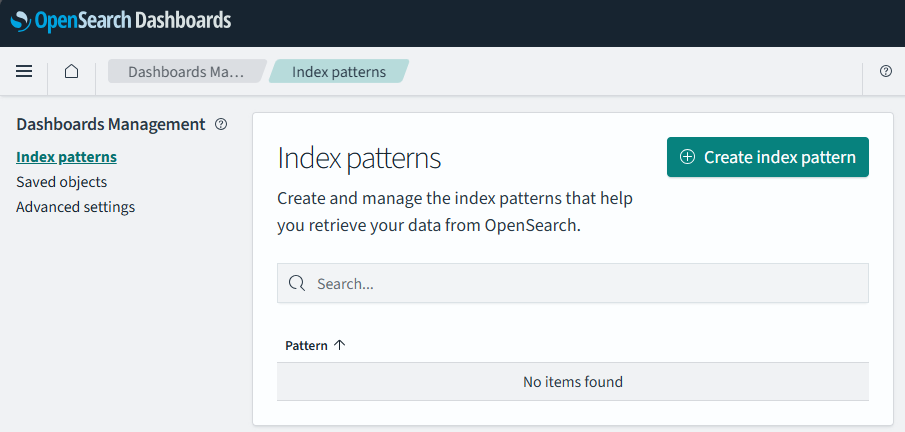
Then select “Index patterns”, then click on the button “Create index pattern”:
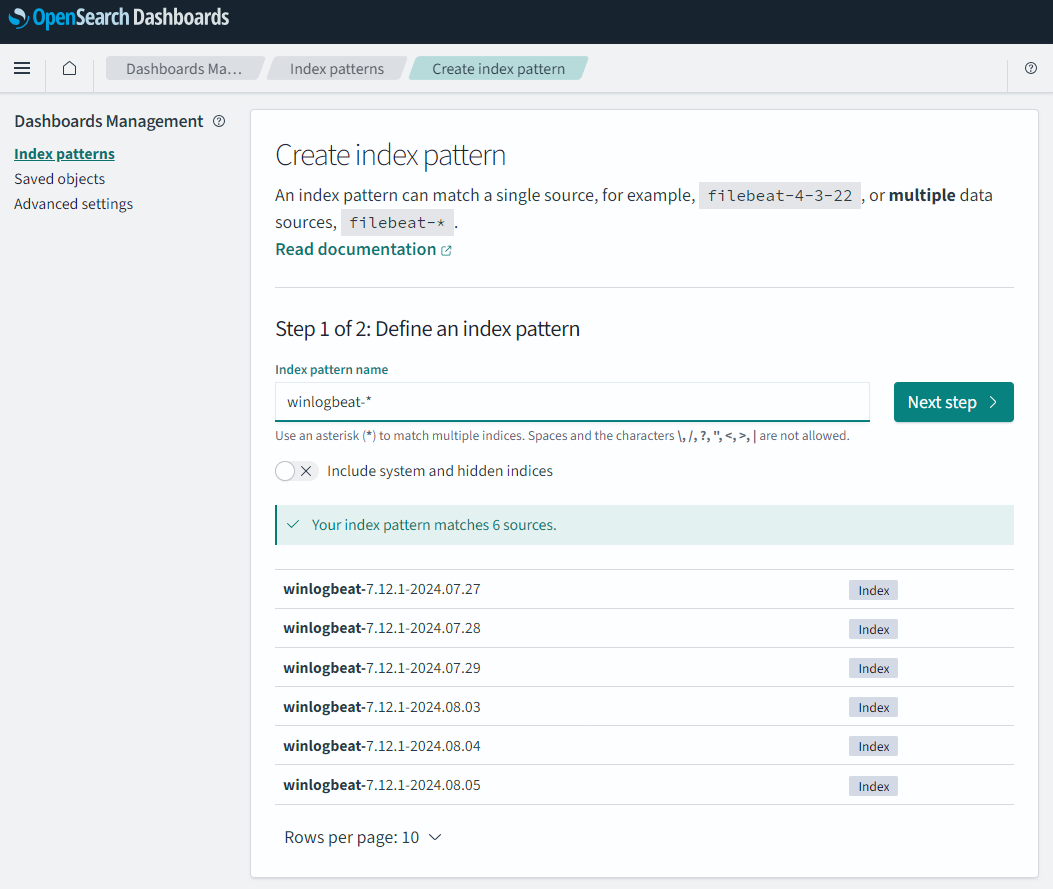
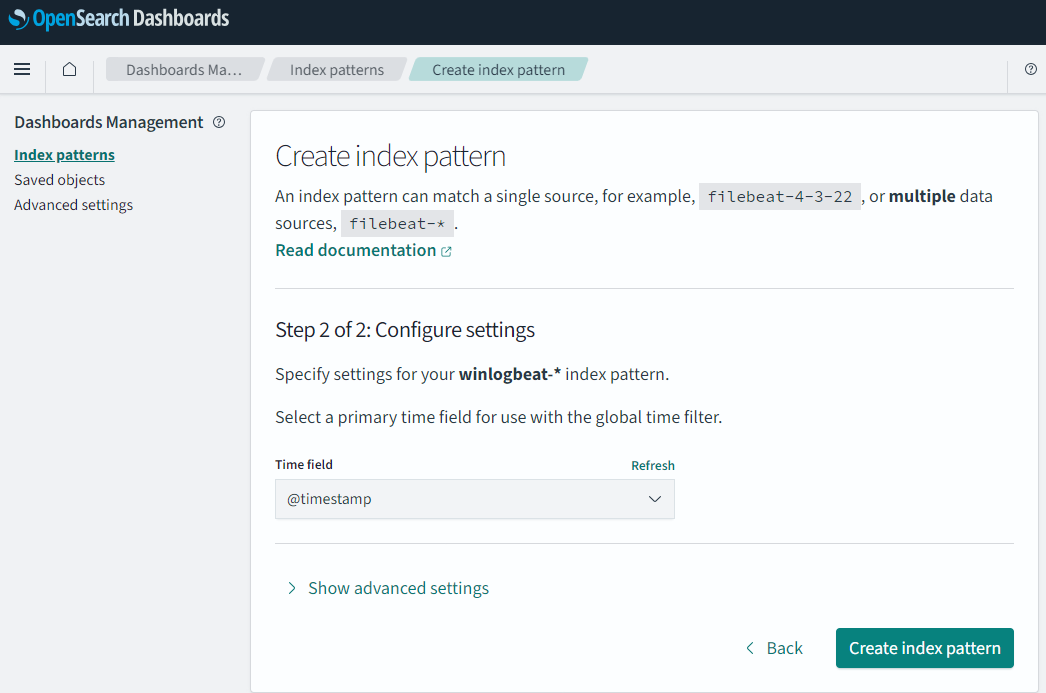
In “Index pattern name” enter a name of choice. Since we now got several logs starting with “logs-”, I find it nice to use the name “winlogbeat-*”. This will easily match the logs I have an interested in. Keep in mind the name we enter here will show in “Discovery”.
Then point to a time field to use and click save (as mentioned in the “A note on ndjson format”).
If we go back to “Discover”, we can now see that our “Index alias” is available to us to search in.
Revision
| Revised Date | Comment |
|---|---|
| 06.10.2024 | Improved formatting and wording |

