Ingesting with Filebeat
Author: Roger C.B. Johnsen
Introduction
Filebeat is a lightweight log shipper designed to forward and centralize various types of logs. As part of the Elastic Stack (ELK Stack), Filebeat is specifically tailored to collect logs and send them to Elasticsearch, Logstash, or third-party services for analysis and visualization. When we refer to Filebeat as a “shipper,” we mean it’s a tool that takes your logs and sends them to a SIEM, to put it simply.
Obtaining and Installing Filebeat
- Download the WINDOWS ZIP 64-BIT version of Filebeat OSS 7.12.1 from this link .
- Create a folder at
C:\Filebeat. - Move the downloaded ZIP archive to the
C:\Filebeatfolder and extract it.
After extraction, the full path to the filebeat.exe binary will be:
C:\Filebeat\filebeat-oss-7.12.1-windows-x86_64\filebeat-7.12.1-windows-x86_64\filebeat.exeHowever, using this long path to run Filebeat can be cumbersome. To simplify this, let’s do some initial housekeeping. In PowerShell, move the inner folder to C:\Filebeat\filebeat with the following command:
mv .\filebeat-oss-7.12.1-windows-x86_64\filebeat-7.12.1-windows-x86_64 .\filebeatThis approach allows us to place the logs we want to ingest in the C:\Filebeat folder (hrough subfolders), making it easier to run the Filebeat binary from a nearby directory via the command line.
Helpful Information for Working with Filebeat
Directory Structure
| Path | Type | Description |
|---|---|---|
C:\Filebeat\filebeat\modules.d | Folder | Contains YAML configuration files for each module. By default, these files have a .disabled extension. You must enable each module you want to use. |
C:\Filebeat\filebeat\filebeat.yml | File | The main Filebeat configuration file, where you set credentials and hostname for connecting to OpenSearch, and other settings like processors |
C:\Filebeat\filebeat\data | Folder | Stores data that Filebeat uses to track what has been ingested. If logs stop appearing in OpenSearch, try deleting this folder and re-ingesting. |
Logs Supported by Filebeat Out of the Box
Filebeat OSS 7.12.1 supports the following log sources out of the box:
| Module | Description |
|---|---|
| apache | Parses access and error logs created by the Apache HTTP server. |
| auditd | Collects and parses logs from the audit daemon (auditd). |
| haproxy | Collects and parses logs from an HAProxy process. |
| icinga | Parses the main, debug, and startup logs of Icinga. |
| iis | Parses access and error logs created by the Internet Information Services (IIS) HTTP server. |
| kafka | Collects and parses logs created by Kafka. |
| logstash | Parses regular logs and the slow log from Logstash, supporting both plain text and JSON formats. |
| mongodb | Collects and parses logs created by MongoDB. |
| mysql | Collects and parses slow logs and error logs created by MySQL. |
| nginx | Parses access and error logs created by the Nginx HTTP server. |
| osquery | Collects and decodes result logs written by osqueryd in JSON format. |
| pensando | Parses distributed firewall logs created by the Pensando Distributed Services Card (DSC). |
| postgresql | Collects and parses logs created by PostgreSQL. |
| redis | Parses logs and slow logs created by Redis. |
| santa | Collects and parses logs from Google Santa, a macOS security tool that monitors process executions and can blacklist/whitelist binaries. |
| system | Collects and parses logs created by the system logging service of common Unix/Linux-based distributions. |
| traefik | Parses access logs created by Træfik. |
Enabling a Log Module
To enable a log module, refer to the table “Logs Supported by Filebeat Out of the Box.” For example, to enable the Apache module, run the following commands in PowerShell:
cd C:\Filebeat\filebeat
.\filebeat.exe modules enable apacheYou must run this command from the C:\Filebeat\filebeat folder, or you may encounter path and settings issues.
You only need to enable each log module once.
Configuring a Log Module
Continuing with the Apache example, you’ll need to set up the Apache module. First, create a folder in C:\Filebeat for the Apache logs:
mkdir C:\Filebeat\apacheThis folder will hold all Apache logs you wish to ingest. Next, instruct Filebeat where to find your logs by setting the var.paths directive in C:\Filebeat\filebeat\modules.d\apache.yml:
# Module: apache
# Docs: https://www.elastic.co/guide/en/beats/filebeat/7.x/filebeat-module-apache.html

- module: apache
  # Access logs
  access:
    enabled: true

    # Set custom paths for the log files. If left empty,
    # Filebeat will choose the paths depending on your OS.
    var.paths: [
        "C:\\Filebeat\\apache\\*",
      ]

  # Error logs
  error:
    enabled: true

    # Set custom paths for the log files. If left empty,
    # Filebeat will choose the paths depending on your OS.
    #var.paths:
Instructing Filebeat to Connect to OpenSearch
In the main Filebeat configuration file (C:\Filebeat\filebeat\filebeat.yml), locate the “Elasticsearch Output” section and modify it as follows:
output.elasticsearch:
  hosts: ["http://127.0.0.1:9200"]
  username: "hunter"
  password: "hunter"
If using HTTPS, please consider the following:
output.elasticsearch:
  hosts: ["https://127.0.0.1:9200"]
  username: "" # Change this
  password: "" # Change this
output.elasticsearch.ssl.verification_mode: none
Removing Unnecessary Metadata from Filebeat Parsing
By default, Filebeat adds host, client, and agent metadata to log entries. This information is often unnecessary when analyzing Apache logs and can clutter the data. To remove this metadata (optional), update the “processors” section in the C:\Filebeat\filebeat\filebeat.yml file:
processors:
  - add_host_metadata:
      when.not.contains.tags: forwarded
  - add_cloud_metadata: ~
  - add_docker_metadata: ~
  - add_kubernetes_metadata: ~
  - drop_fields:
      fields: ["host", "client", "agent"] # This line is central. Add sectiosn as sees fit for your use.
Enabling OpenSearch Compatibility
If you have already completed this step in other chapters, you can skip it.
Historically, many popular agents and ingestion tools, such as Beats, Logstash, Fluentd, FluentBit, and OpenTelemetry, have worked with Elasticsearch OSS. OpenSearch aims to support a broad range of these tools, but not all have been tested or explicitly marked as compatible. As an intermediate solution, OpenSearch provides a setting that instructs the cluster to return version 7.10.2 instead of its actual version. If you are using clients that perform a version check (such as Logstash OSS or Filebeat OSS versions 7.x - 7.12.x), you can enable this setting:
PUT _cluster/settings
{
  "persistent": {
    "compatibility": {
      "override_main_response_version": true
    }
  }
}
To enable this setting, go to the “Dev Tools” section (“Hamburger menu” -> “Management” -> “Dev Tools”). Paste the above code into the left-side panel, then click the “Click to send request”/“Play” button. The status of the request will be displayed in the right panel, like this:
Ingesting data log
Finally, we’ve arrived at the ingestion step. To ingest the logs in ```C:\Filebeat\apache````, execute the following:
cd C:\Filebeat\filebeat
filebeat.exe -e
This will create a filebeat-7.12.1-2024.08.24 index in OpenSearch. Note the index is named after which shipper sent data to it - and the current date.
Create Index Alias
For us to make use of this new index in “Discovery”, we must set up Index Alias for it.
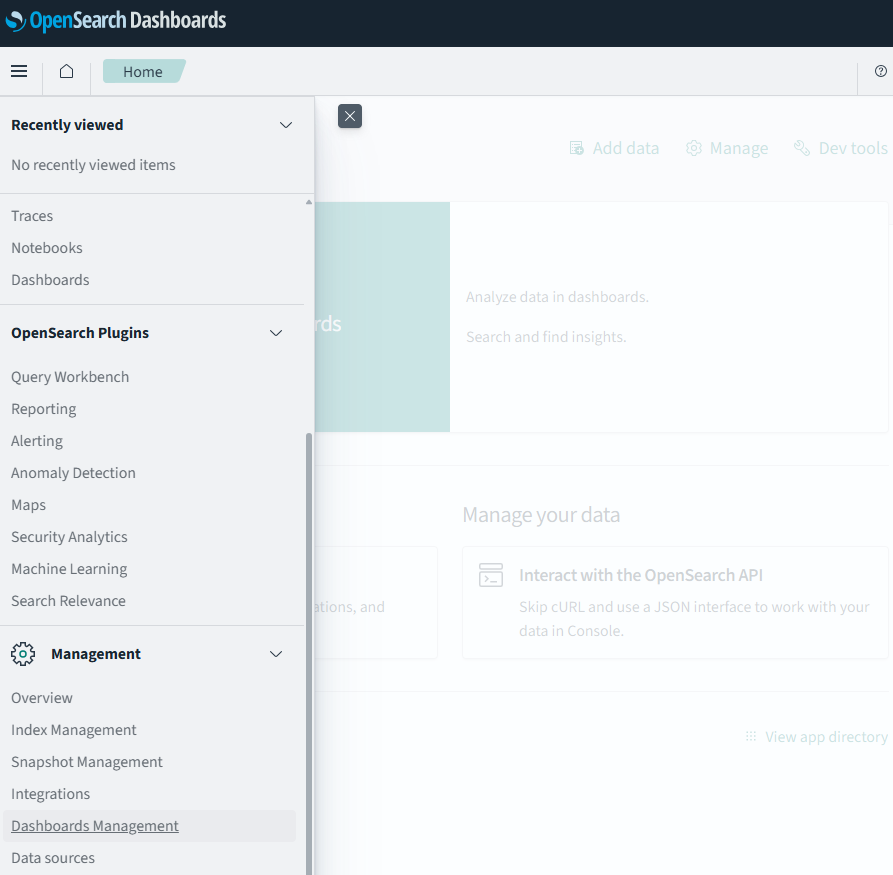
Keep in mind that “Discover” (the main query interface) knows nothing about new indices, thus you can’t search into them directly. You first need to create index aliases for “Discover” to see them. You can do so by reaching the “Dashboard Management” utility by going to this path: “Hamburger menu” -> Management -> “Dashboard Management”:
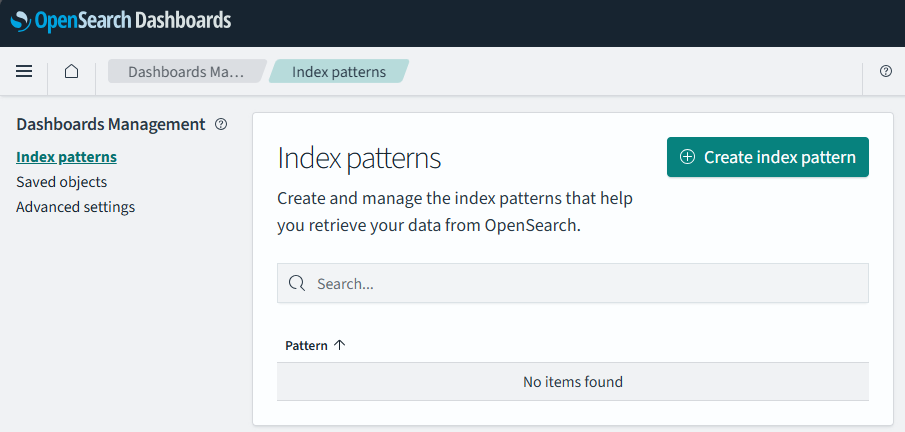
Then select “Index patterns”, then click on the button “Create index pattern”:
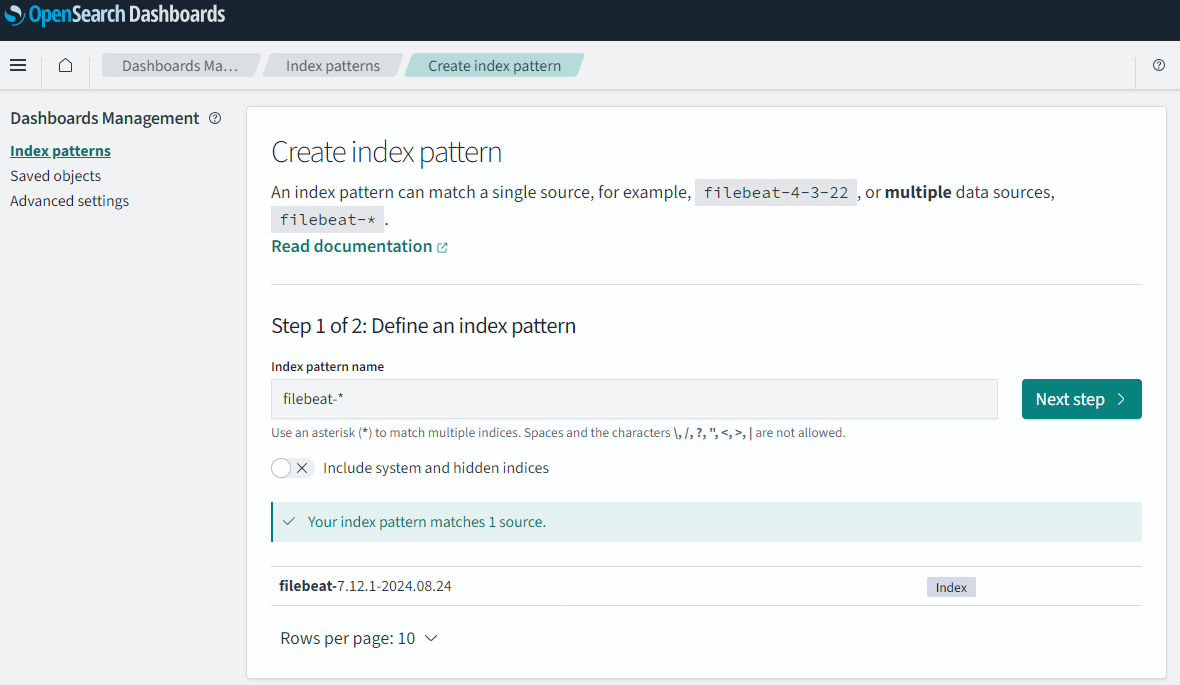
In “Index pattern name” enter a name of choice. Since we now got several logs starting with “logs-”, I find it nice to use the name “winlogbeat-*”. This will easily match the logs I have an interested in. Keep in mind the name we enter here will show in “Discovery”.
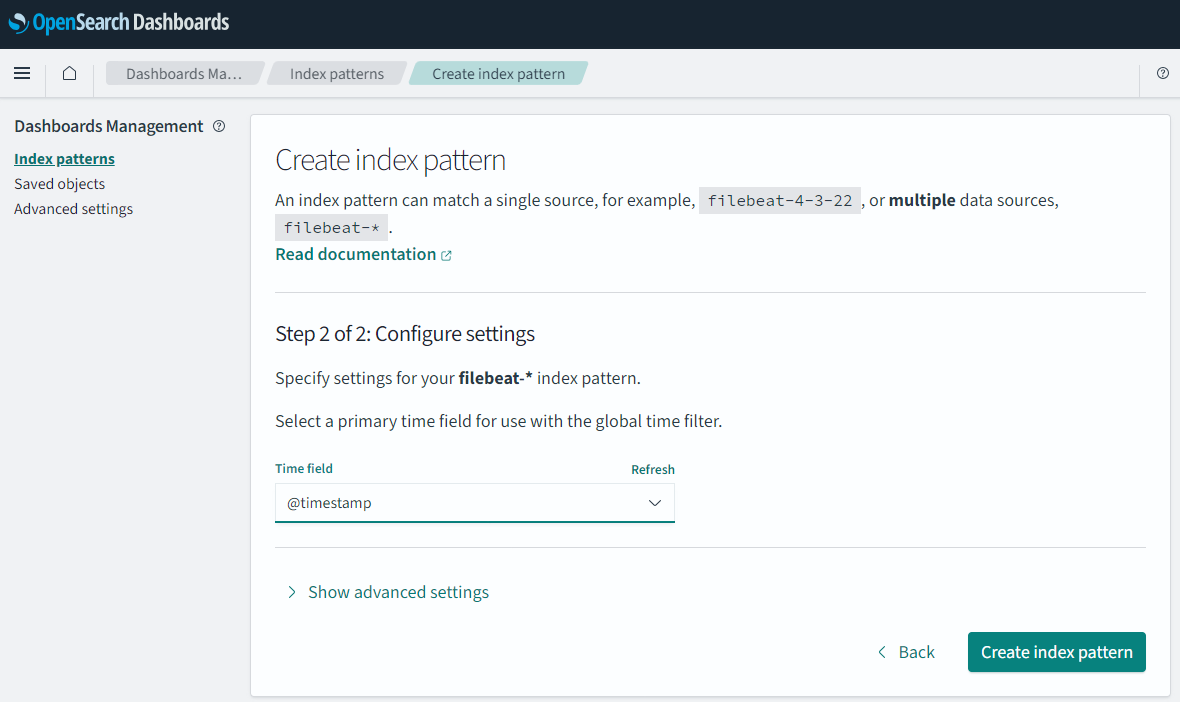
Then point to a time field to use and click save (as mentioned in the “A note on ndjson format”).
If we go back to “Discover”, we can now see that our “Index alias” is available to us to search in.
Revision
| Revised Date | Comment |
|---|---|
| 06.10.2024 | Improved formatting and wording |


